Stock SearchTool Screener Results
Disclaimer: This is NOT investment advice, just general help and opinions. Please check with a registered investment
advisor before making any investment decisions. This
document may contain errors. Chapman Advisory Group LLC employees are not investment advisors. Please review:
http://www.stockconsultant.com/disclaimerpage.html
 Topics
- SearchTool screen results
- SearchTool list options
- Chart options
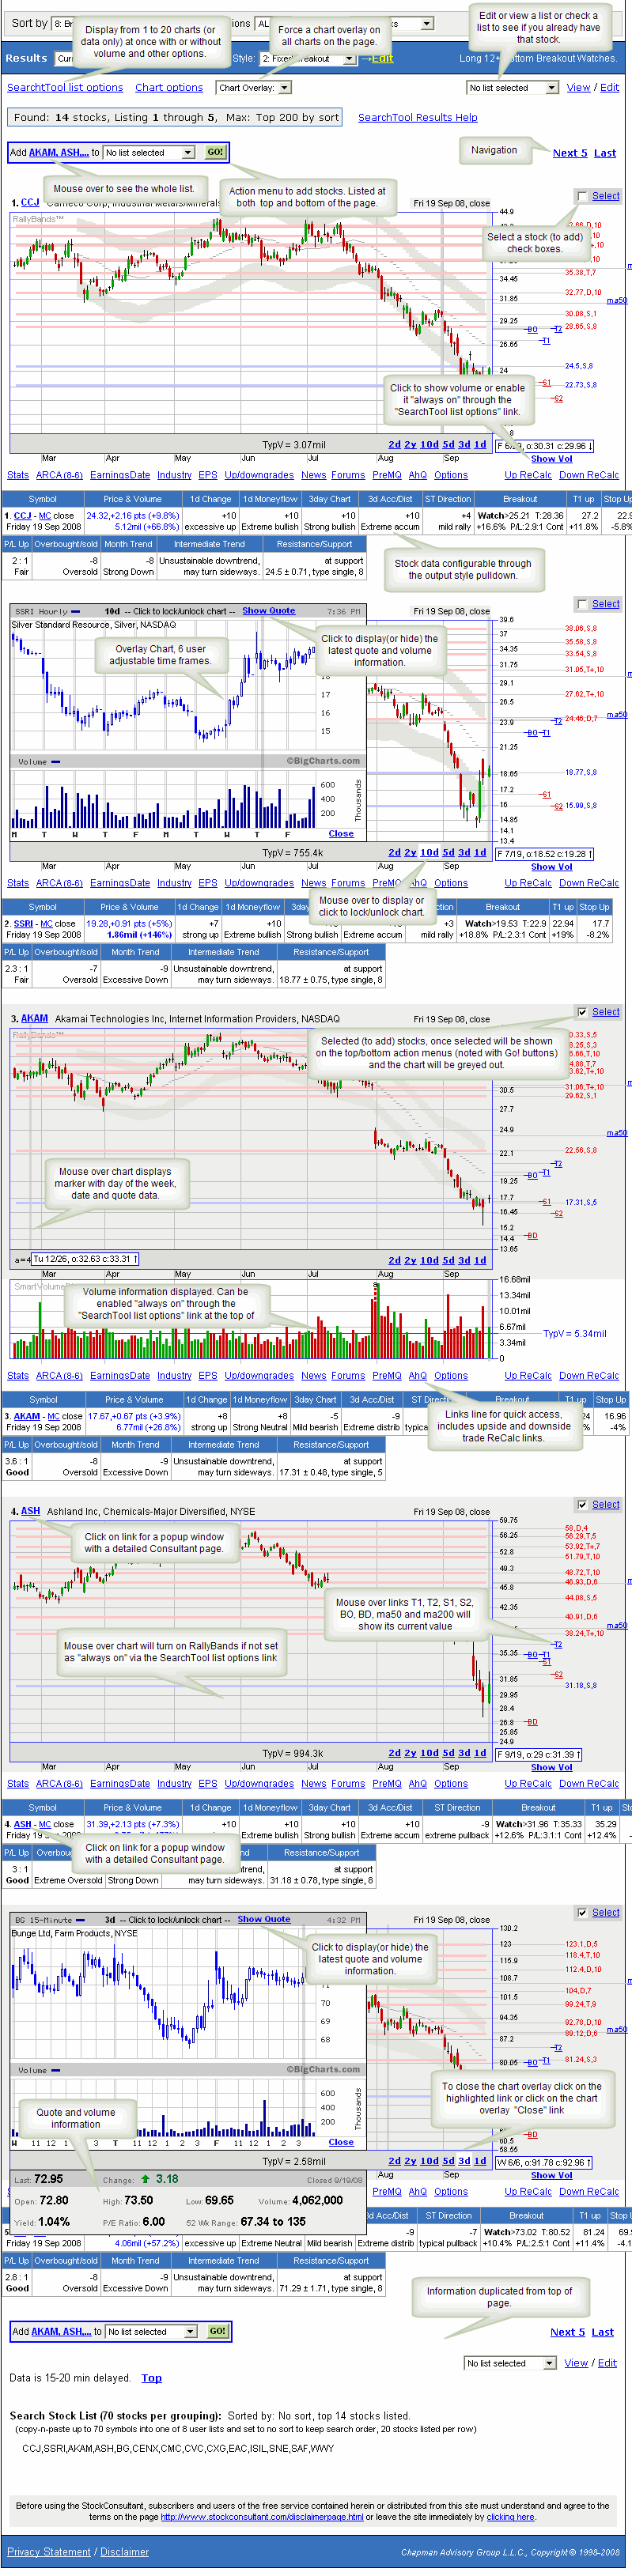
SearchTool screen results
- Display from 1 to 35 stock charts (or data only) at once with or without volume and other options.
- Force intraday stock chart overlay on all charts on the page.
- An action menu to add stocks is listed the top and bottom of the page.
- Click link to show stock volume or enable volume "always on" through the "SearchTool list options" link.
- Configure the SearchTool result fields using the output style pulldown.
- 6 user adjustable time frames for the overlay intraday stock chart.
- Mouse over the daily chart to show a vertical marker with day of the week, date and stock quote data.
- Important stock news and data links are listed below each chart.
- Mouse over chart links T1(stock upside target 1), T2 (target 2), S1 (downside target 1), S2 (target 2), BO (breakout), BD (breakdown), ma50 (50 day simple moving average), and ma200 (200 day moving average) to display its current value.
- Click on stock symbol links for a detailed stock report page.
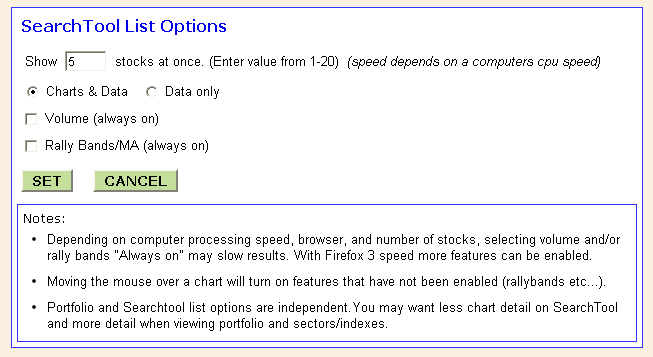
SearchTool list options
- SearchTool list options link is displayed just below the SeachTool results bar.
- Searchtool and Portfolio have independent list options.You may want less chart detail on SearchTool
and more detail when viewing portfolio and whole sectors/index lists.
- Choose to display between 1 and 35 stock charts at sone on the screen resuls page.
- Turn on stock charts and data or just data only.
- Display stock volume below each chart.
- Turn on rally bands and moving averages.
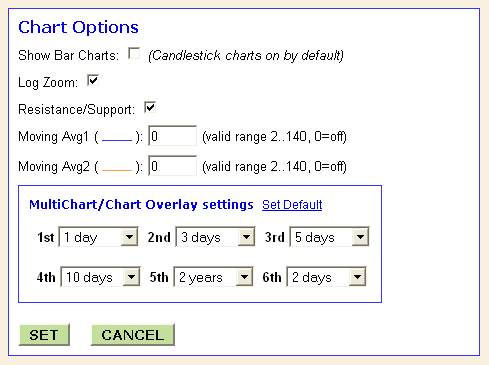
Chart options
- The chart options link is displayed just below the SearchTool results bar.
- Choose between bar and candlestick charts.
- Turn on stock resistance and support areas.
- Setup simple 2 to 140 day moving average lines.
 Back to help topics