Trading Guide - Chapter 4
 Contents
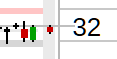
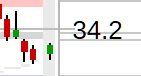
Support and Resistance
- Blue lines below are support areas
- Red lines above or at are resistance areas.
- Grey lines for support or resistance areas can form when a price has had little movement over a long period.
- Support is below the current stock price, and resistance is above.
- Stocks pullback to support and rally to resistance.
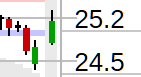
- The format is support/resistance price, type, and strength. See the next section for the definitions.
- The type single (S), double (D), triple (T), and triple+ (T+) represents the number of times the stock has held or paused at a price area. The more times, the stronger the support or resistance.
- The strength represents the support volume, and resistance ranges from 1-10 (most significant).
- Each support and resistance covers a +/- points price area.
8 Month Chart Rally Bands
- A stock may rally (or pull back) to the shaded Rally Band area and then reverse or consolidate.
Indicators

Quote
- Today's typical and extreme price range helps decide when an intraday price move has been excessive and a possible top or bottom area has been made for the day.
Volume
- The number of shares traded in a trading session compared to what is expected at that time of day (end-of-day daily volume compared to the past 6 months).
- Typical daily volume indicator line is found on the 8 month chart.
- Typical volume uses a proprietary algorithm to calculate and remove high and low-volume days that may skew the reading.
- Strong volume early in the trading session may help confirm breakouts or dip buying at support areas.
Rallies/Pullbacks
- The expected typical and extreme rallies (in stock points and %) may occur from support at the current price for momentum trades.
1 Day Price Change
- Helps prevent chasing a stock upward on the day you may want to add a long position.
- For intraday traders, a -9 or -10 reading is an extreme intraday move and possible long opportunity (+9,+10 for possible short opportunity).
- You can screen for intraday extreme 1-day price change.
Short Term Direction
- Measures rallies and pullbacks over one to three weeks.
- Tke profits on a long position after an extreme rally (9-10).
- Signals pullbacks for entries on momentum (with trend) long trades.
- Helps avoid entering a breakout trade after a strong/excessive rally (8+).
Overbought/sold
- A medium-term indicator measures a one to three-month-long stock uptrend and signals whether it is overbought (or oversold for one to three-month pullback).
- Cautions on entering a breakout trade when overbought.
1 Month Trend
- Measures how fast the stock price has rallied over the past month (slope).
- Extreme month trend readings of 9 or 10 rarely continue for another month.
- Flat month trend can be used for determining stock tops and bottoms (Use screener).
- Bottom breakouts may have a higher probability of success after a flat month trend.
Intermediate Trend
- Longer term indicator, which measures the four-month stock trend.
- Uptrend for entries on momentum long trades.
- Screen for the start of an intermediate trend higher.
3 Day Candlestick
- Uses over 120 candlestick patterns to analyze the past 3-day candlestick chart.
- Patterns ranked as neutral (0), mild bullish (+5) and bearish (-5), strong bullish (10) and bearish (-10)
3 Day Accumulation
- Strong accumulation enhances the credibility of the 3 day candlestick pattern.
- Strong accumulation at the start of a breakout increases the odds of a follow-through.
- On pullbacks, a stock bottom may occur with an extreme accumulation reading of 9 or 10.
MoneyFlow (1 day)
- A short-term indicator measuring the 1 day money flow compared to previous history.
- The end of a rally or pullback may have an extreme 1 day money flow reading of 9 or 10.
Disclaimer: This is NOT investment advice, just general help and opinions. Please check with a registered investment
advisor before making any investment decisions. This
document may contain errors. Chapman Advisory Group LLC employees are not investment advisors. Please review:
https://www.stockconsultant.com/disclaimerpage.html